Processes
What is running, busiest first, with its memory; :3000 lists what listens on a port.
 palv0.1.0Systembundled
Ships inside pal. Installing puts an editable copy ahead of the bundled one.
What it does
Processes
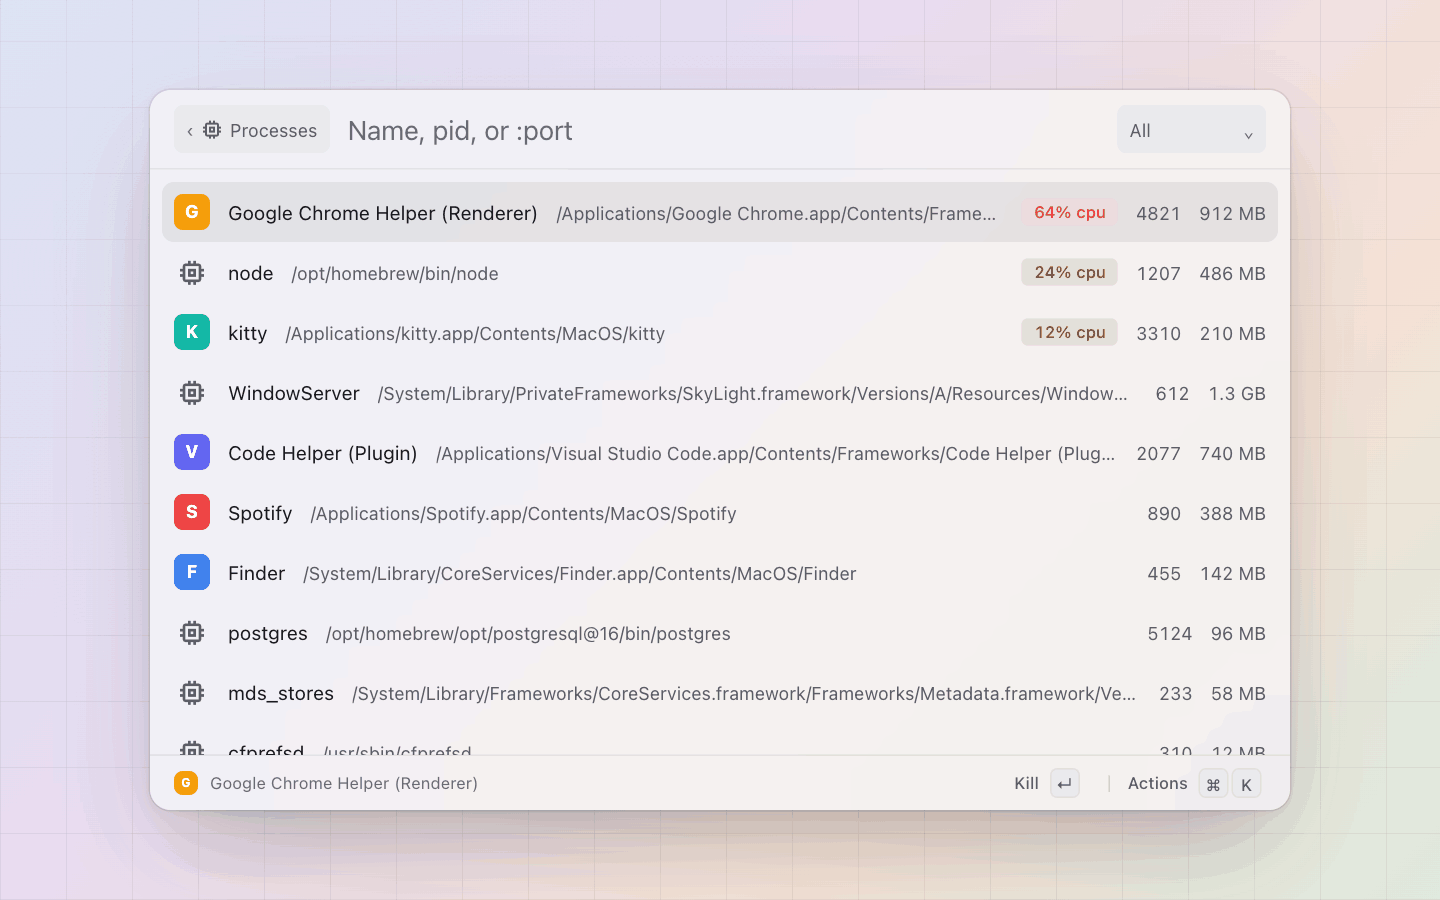
What is running, from ps, listed again on every keystroke because the
set changes constantly (an input palette; the root only has its own row).
The query matches the name or a pid prefix. The row is the executable's
name, its full path the subtitle on macOS (Linux ps gives only the
name); the pid and the resident memory sit on the right, and a process
above 10% CPU carries a NN% cpu tag (amber, red from 50%). Rows are
sorted by CPU, then memory. On macOS a process that lives in a .app
bundle gets that app's icon.
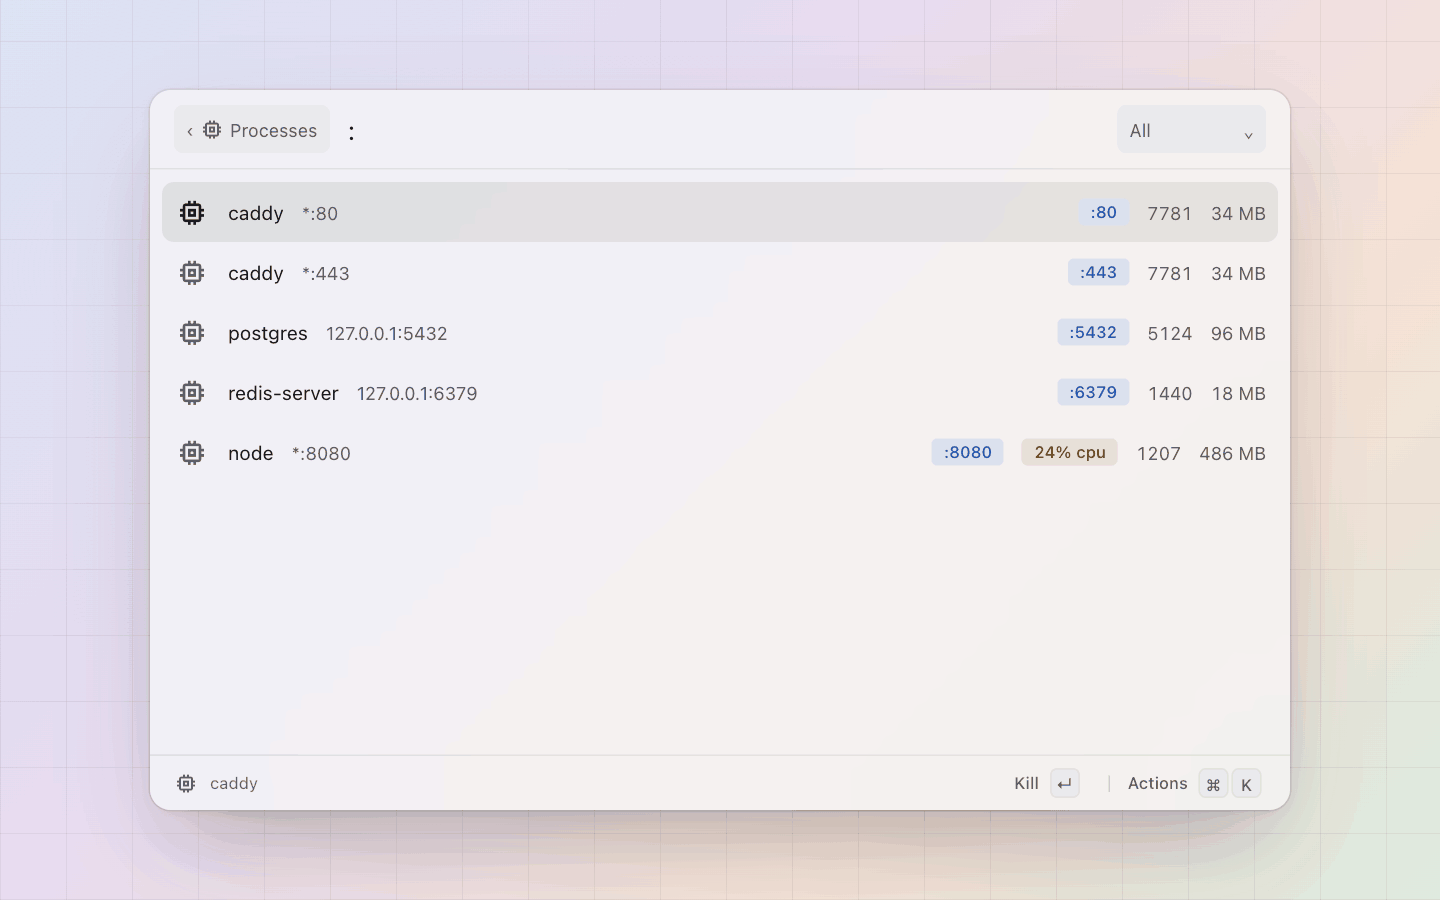
A query of : and digits lists what listens on TCP ports instead of
processes: :3000 that port, :30 every port starting with 30, :
alone every listener. One row per process and port with the port as a
blue tag and the address as subtitle; a process ps knows gets its usual
numbers and icon. ss -ltnp on Linux, else lsof -iTCP -sTCP:LISTEN
(macOS ships it). A row's id is pid:port, and it has the same actions.
The filter dropdown (tab cycles it) scopes the list:
| filter | rows |
|---|---|
| All | everything (the default) |
| Mine | your own user's processes |
| Top CPU | the 25 busiest |
| Top memory | the 25 largest, by resident memory |
Keyboard
| keys | action |
|---|---|
enter |
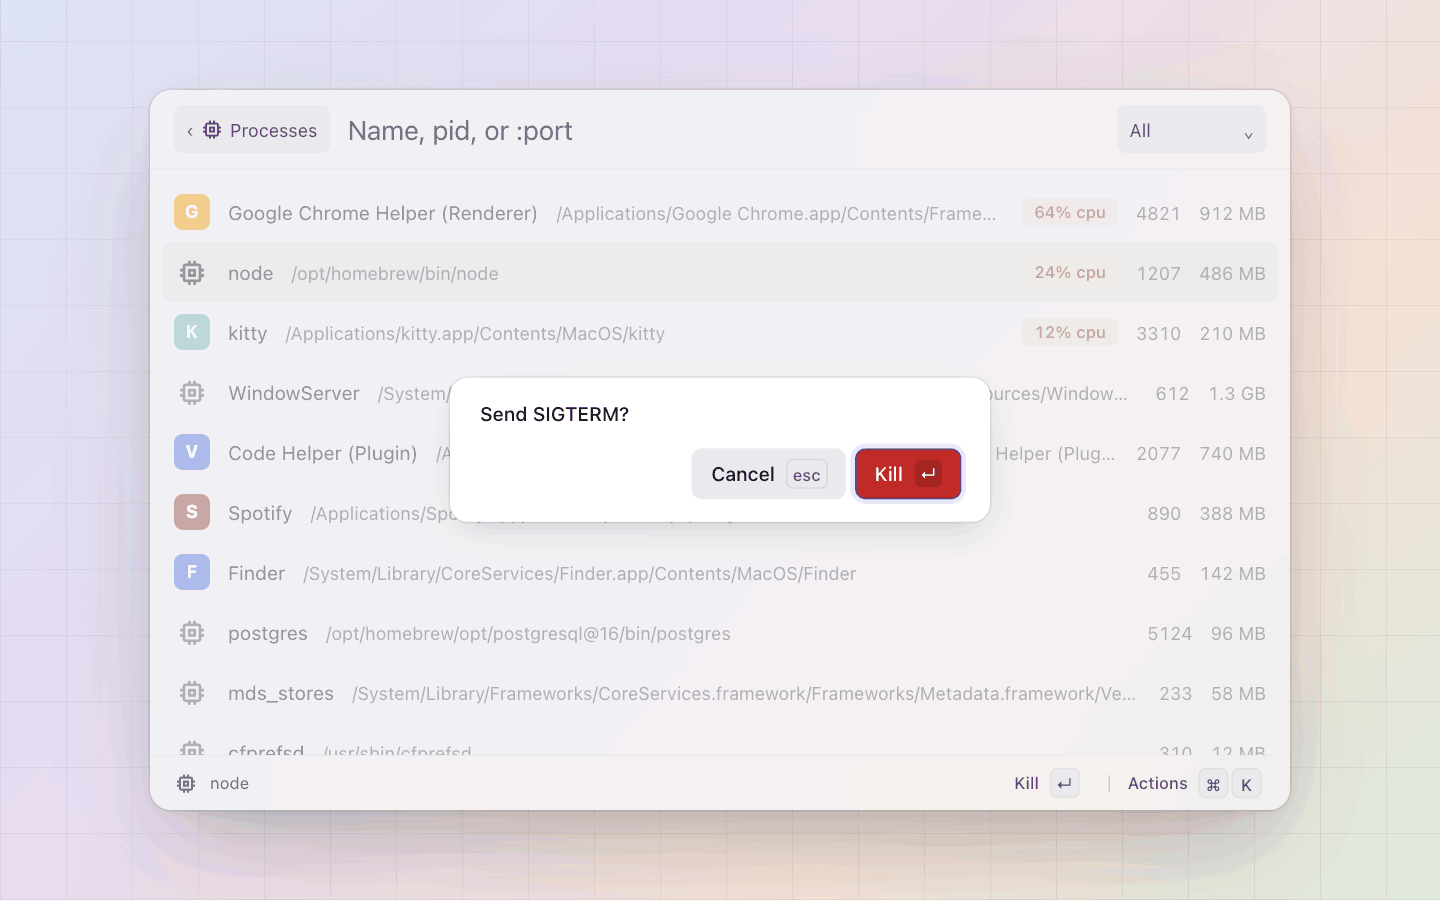
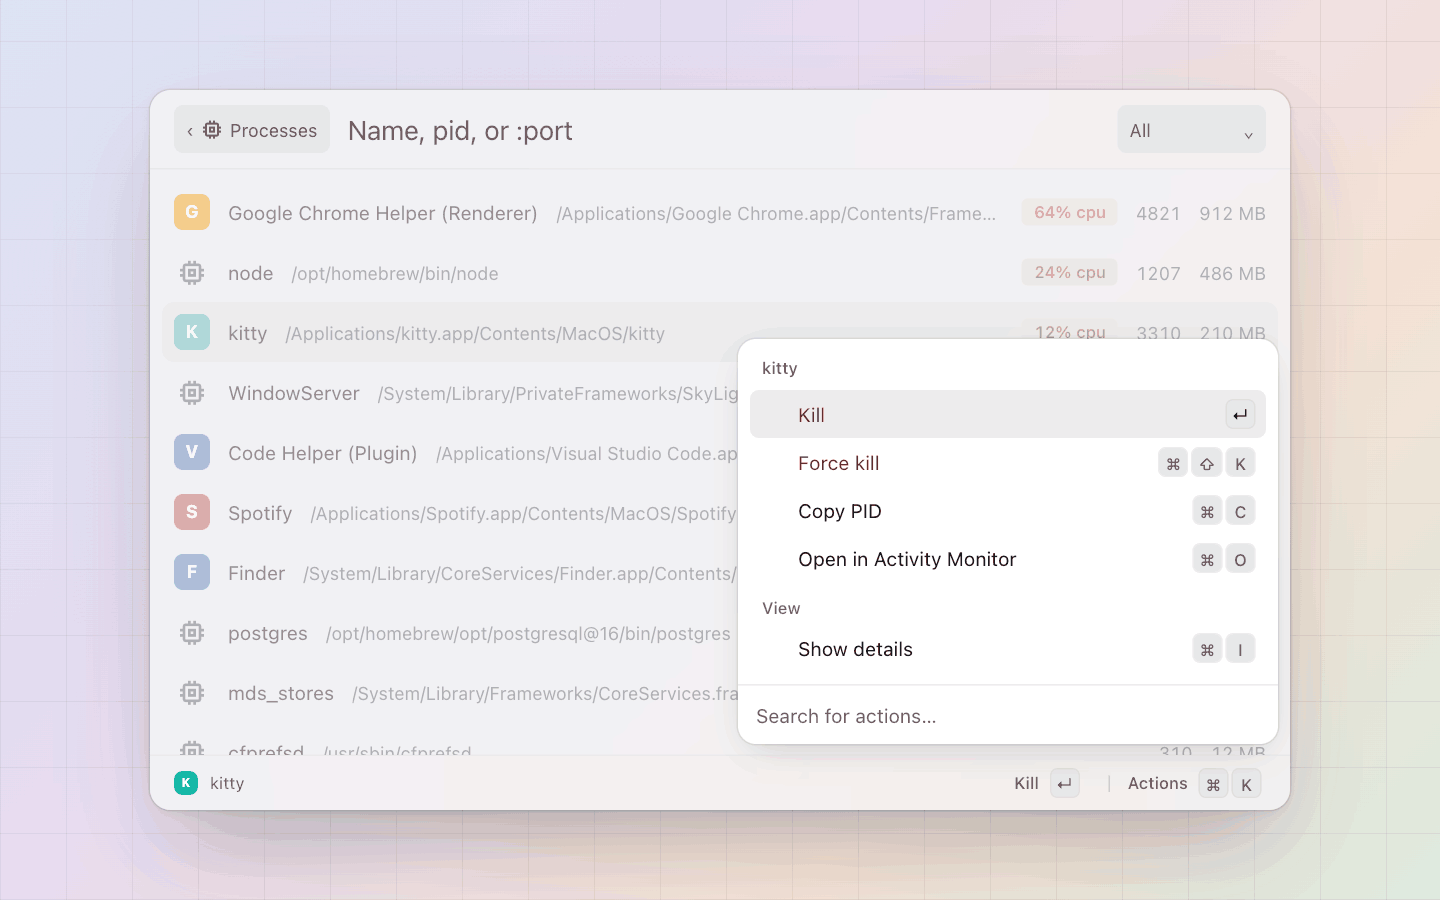
Kill: SIGTERM, after a confirm; the palette stays open and lists again |
cmd+shift+k |
Force kill: SIGKILL, after a confirm |
cmd+c |
Copy PID |
cmd+o |
Open in Activity Monitor (macOS): brings the app up and types the pid into its search field |
tab |
Next filter |
A kill that fails (a process of another user, a pid that is gone) keeps the panel open with a toast carrying the OS's message.
Setup
Nothing to install: ps is everywhere, lsof ships with macOS, ss
with most Linux distributions (without either the port query shows one
hint row saying which to install). Open in Activity Monitor types the pid
through System Events, which asks for Automation once and needs
Accessibility for the keystrokes; without it the app just comes up.
Settings, [extensions.processes]:
| key | type | default | what |
|---|---|---|---|
include_system |
bool | false |
List system processes too: pids below 100, and kernel threads (children of kthreadd) on Linux. |
What it does not do
- Kill by name: the rows are processes, one pid each. Type the name, then kill the rows you mean, one at a time.
- Killing another user's process: no sudo, so the toast carries the OS's refusal.
- Other signals:
SIGTERMandSIGKILLonly. - UDP or remote sockets: the port query lists TCP listeners.
- pal's own host process is left out of the list.
Platforms
macOS and Linux. The full path as subtitle, app icons and Open in
Activity Monitor are macOS; kernel threads and ss are Linux.
Palettes 1
-
Processes
processesinputEvery process, by CPU then memory.
- ↵Kill (asks first)
- ⌘⇧KForce kill
- ⌘CCopy the pid
- ⇥Next filter: Mine, Top CPU, Top memory
Actions
- KillSIGTERM, after a confirm.↵
- Force killSIGKILL, after a confirm.⌘⇧K
- Copy PID⌘C
- Open in Activity MonitormacOS: brings Activity Monitor up with the pid in its search field.⌘O
Settings
Extension, [extensions.processes]
include_systemDefaults shown. Change them in pal's settings window or in the config file.